I wrote a small book a few years ago to catalog my SQL learning journey, Geospatial Analysis with SQL: A hands-on guide to performing geospatial analysis by unlocking the syntax of spatial SQL.
The idea for my books was to set the stage for learning beyond its pages. Let’s set the framework and sprinkle in a healthy amount of self discovery and agency. Some folks get it, some don’t. But the proof in the pudding has been the accessibility to artificial intelligence and ‘vibe coding’. Vibe coding without foundational expertise is like dancing without music. Sure, you can move your limbs about and sway discriminately but to what end?
SQL and the City started as a living testament to not only SQL but how we look at cities, built infrastructure and “place” — what is access like across the territory. This book taught me more than SQL. I had to fight every step of the way. The publisher did not want my photo on the cover. I didn’t want my picture on the cover out of thin air. There were books from the publisher on my bookshelf with white men on the cover. I insisted that they include mine. I was thinking of other women with varying shades of melanin in their skin seeing possibility in technology fields.
Next, the book was printed without any color images. The same color images that I was required to hand select to keep print costs reasonable. Initial printing was halted after launch once I discovered the error and another printing had to be arranged — not without pressure from the author…ahem. Second launches are riddled with complications, ask me how I know.
But that is all in the past. You own your experiences and hopefully learn from all of them. SQL is a robust tool to have in your workflow and I am excited to revisit a few of the modern applications.
What types of questions are you asking? I started with parcel data because it is robust unlike building footprint data.
Provide SQL code that uses these columns to ask questions about building infrastructure, energy use, planning and other attributes related to city buildings.


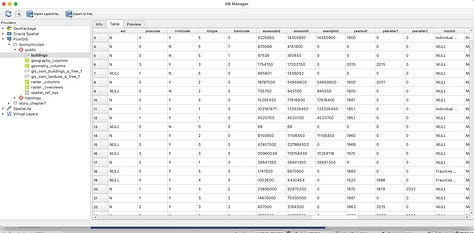
You can see the columns and begin to build questions that you might have around the buildings in a specific area.
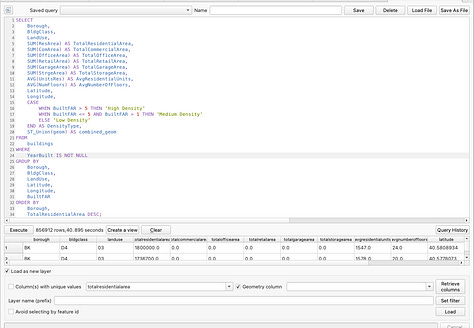
SELECT Borough, BldgClass, LandUse, SUM(ResArea) AS TotalResidentialArea, SUM(ComArea) AS TotalCommercialArea, SUM(OfficeArea) AS TotalOfficeArea, SUM(RetailArea) AS TotalRetailArea, SUM(GarageArea) AS TotalGarageArea, SUM(StrgeArea) AS TotalStorageArea, AVG(UnitsRes) AS AvgResidentialUnits, AVG(NumFloors) AS AvgNumberOfFloors, Latitude, Longitude, CASE WHEN BuiltFAR > 5 THEN 'High Density' WHEN BuiltFAR <= 5 AND BuiltFAR > 1 THEN 'Medium Density' ELSE 'Low Density' END AS DensityType, ST_Union(geom) AS combined_geom FROM buildings WHERE YearBuilt IS NOT NULL GROUP BY Borough, BldgClass, LandUse, Latitude, Longitude, BuiltFAR ORDER BY Borough, TotalResidentialArea DESC; Here is the accessible data:
I am writing the story that I will share from the stage. SQL also has a home with the 3D tile sets. Not specifically impacting the tiles directly but we can manipulate data through the attribute tables.
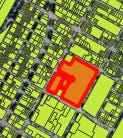
I did a workshop where we simply explored the parcel data set…here is a snippet.
To view in QGIS don’t forget to check the column with your geom data.
Let me know if you plan on being in NYC. It would be great to meet you!


